Introduction: The Reason Every Crypto Learner Needs to Know The Basics of Trading.
In case you have only recently learned what crypto is, the following major discovery is how crypto trading works and how to interpret charts.
The simplest way to make money trading is by buying and selling crypto and charts can help you identify price movements and trends. Although you might not aspire to be a full-time trader, you will be better equipped to make better investment decisions and understand the reasons why the market acts in a particular manner.
What Is Crypto Trading?
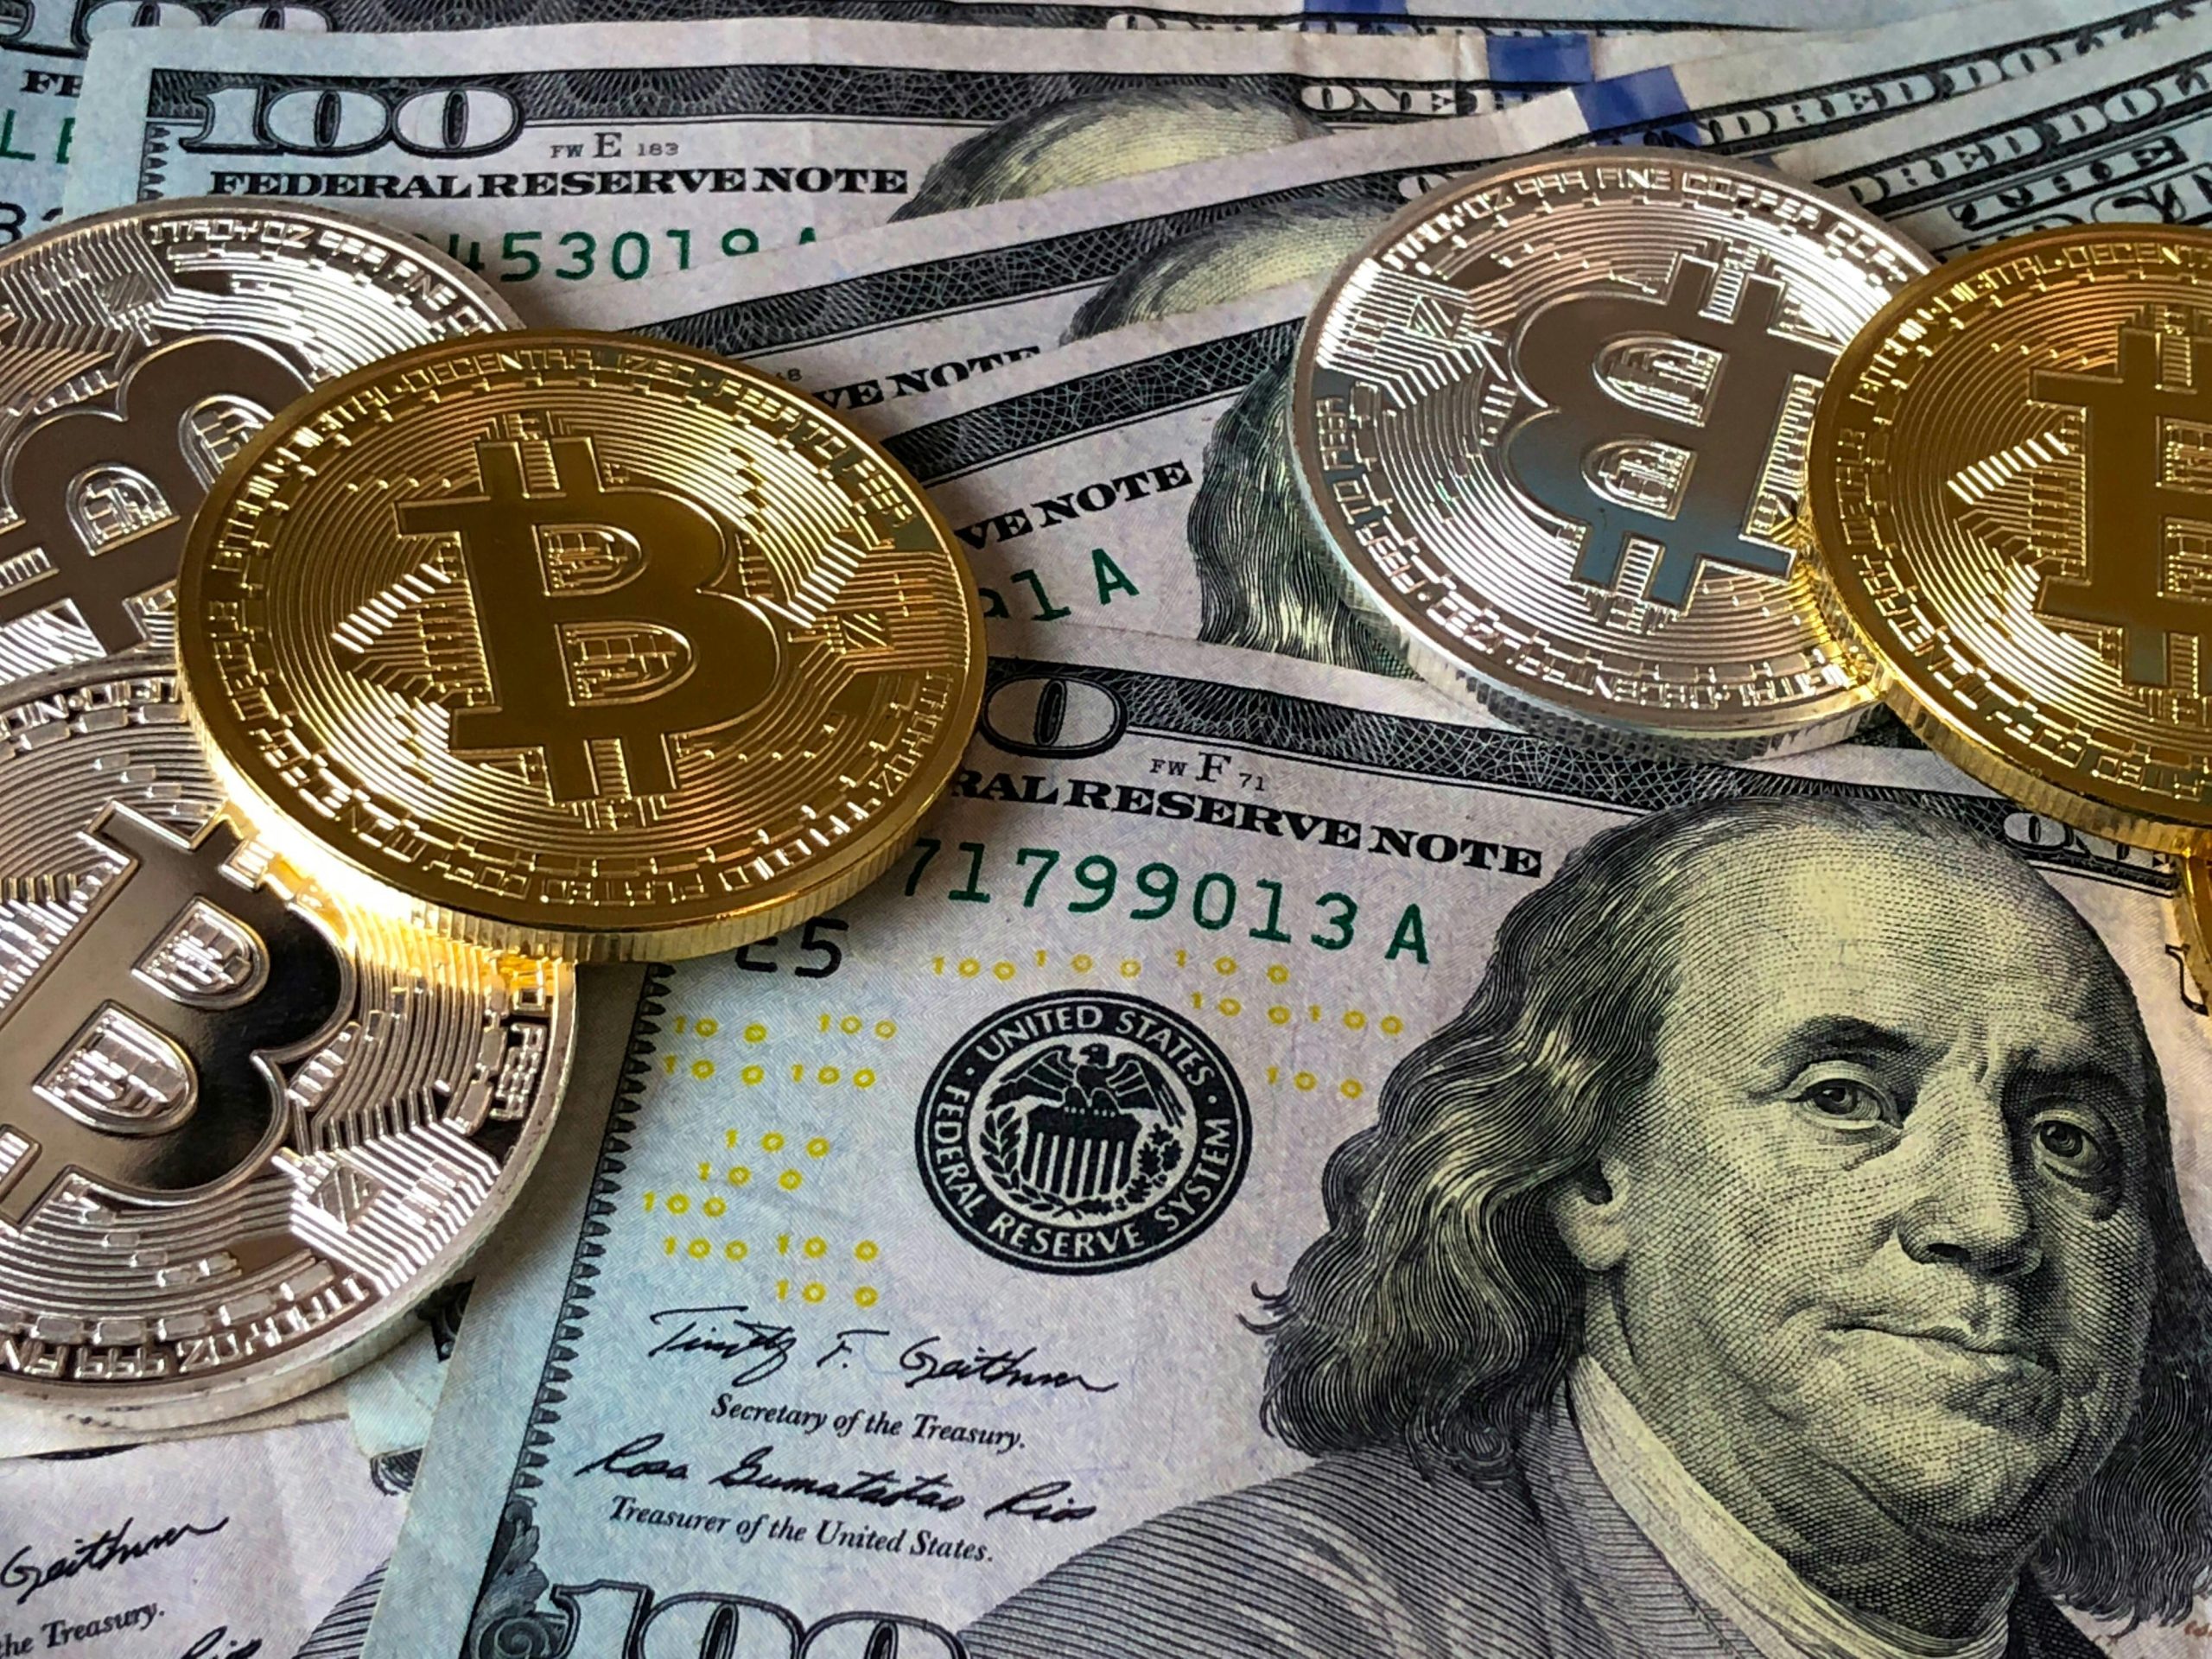
Cryptocurrency trading involves the exchange of one digital currency with another or with real currency (such as USD or EUR) generally by means of an online platform known as an exchange.
Similar to trading in stock, crypto trading is reduced to:
Purchasing low, and selling when prices are high.
However, crypto markets operate 24/7, meaning prices can change every minute, day or night.
Where Does Crypto Trading Happen?
You do it on crypto exchanges, the digital marketplaces where buyers and sellers are introduced.
Popular Exchanges:
- Binance
- Coinbase
- Kraken
- KuCoin
- Bybit
Most exchanges let you:
- Deposit funds
- Place buy/sell orders
- Monitor charts and assess performance.
- Pull out your profits safely
Types of Crypto Trading
There is no universal crypto trading. Here are the main styles:
- Spot Trading – You sell and buy crypto instantly- snatching a Bitcoin at the current price.
- Futures Trading – You either sell or purchase crypto at a predetermined rate.
- Margin Trading – You lend out money you are trading more than you have.
- Day Trading vs. Swing Trading – Day traders make purchases and sell in one day. Swing traders stay several days or weeks and take advantage of price swings.
Spot trading is the easiest and safest to get started with, especially when done by a newcomer.
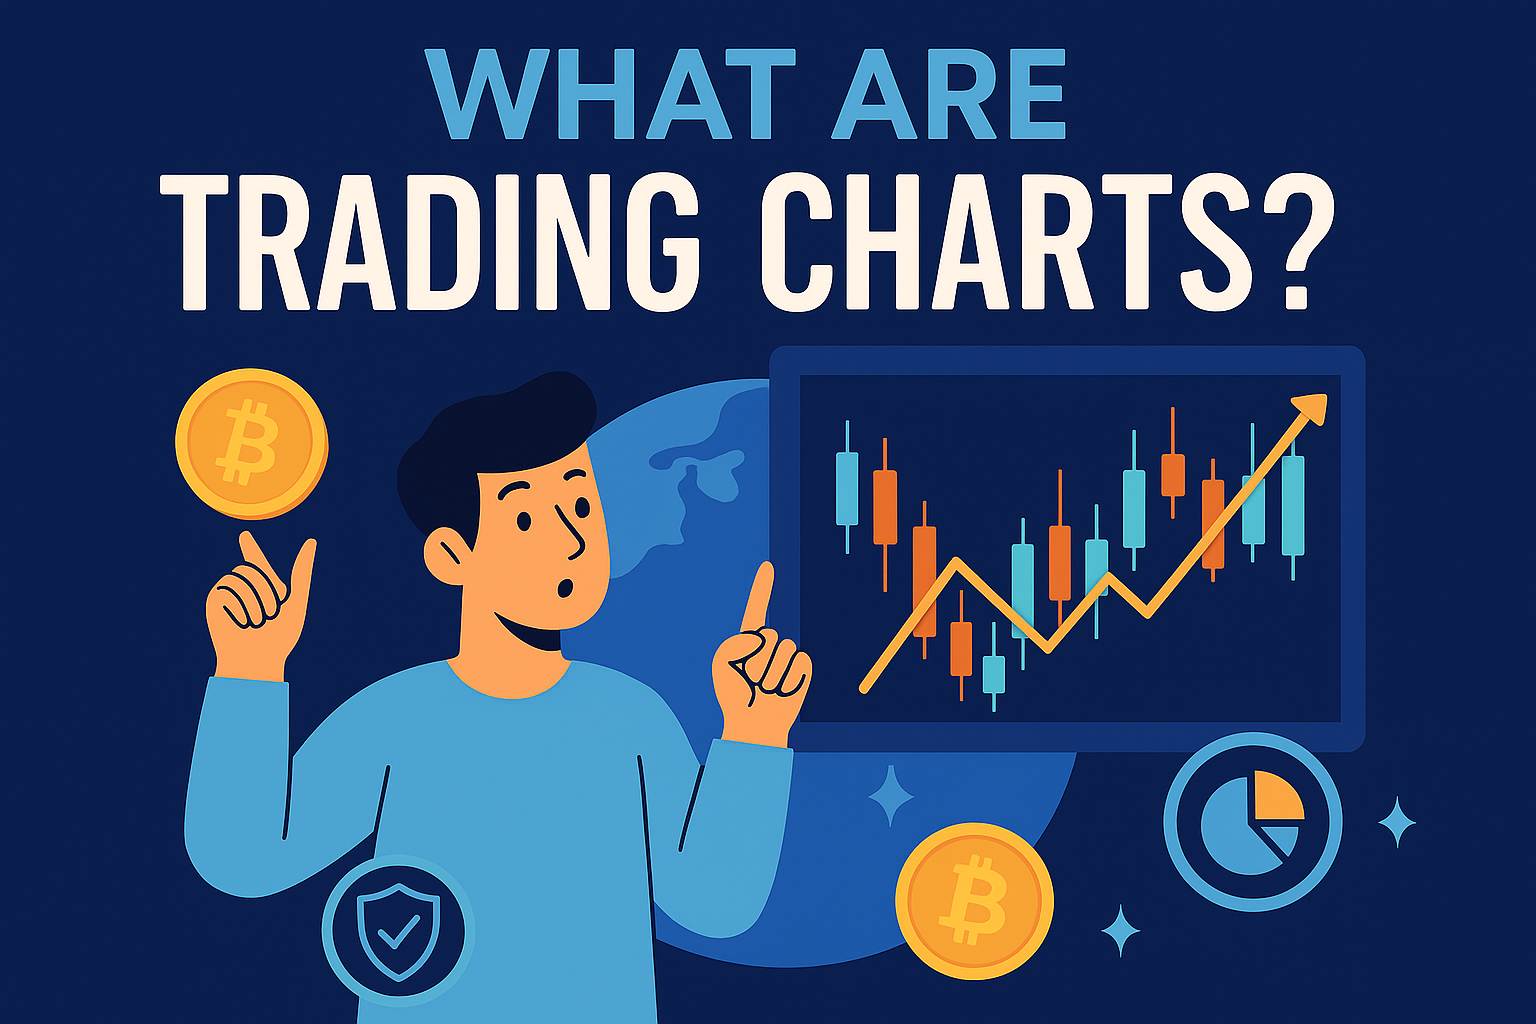
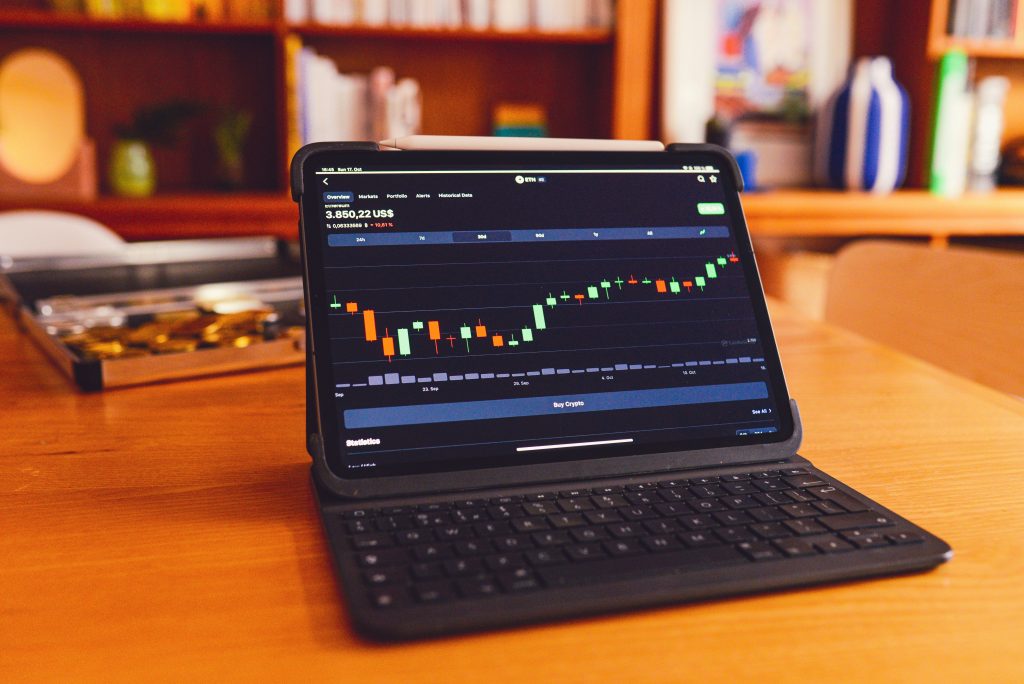
Understanding Crypto Charts
Just open a trading page and you will have colorful charts which may seem confusing at the very beginning, but which convey a strong story.
A crypto price chart indicates the way that the price of a coin has fluctuated. The chart is also defined by candles or lines each representing a certain period of time such as 1 minute, 1 hour, or 1 day.
Essentials of Candlestick Chart
The most popular appearance in crypto trading is candlestick charts.
Each candle shows:
- Open price: The price at the beginning of the period
- Close price: It is the price at the end of the period
- High: The highest price during that time
- Low: The lowest price during that time
Red candle – Price fell,
Green candle – Price rose
When you see one or two or more green candles, you know the market is rising (bullish). Several red candles imply that prices are falling (bearish).
Key Terms to Know
| Term | Meaning |
|---|---|
| Bull Market | Prices are rising, everybody feels good. |
| Bear Market | Prices are falling, traders are cautious |
| Support Level | Price at which a coin is likely to stagnate. |
| Resistance Level | Price at which a coin finds it difficult to ascend. |
| Volume | The number of coins that were traded – indicates the strength of the move. |
| Market Cap | Value of a cryptocurrency (Price x Circulating Supply) |
Mastering these fundamentals gets you ahead of why the prices are moving and finding sound opportunities.
Trading Expert Tools and Indicators.
Technical indicators tend to be used by crypto merchants to identify trends and points of entry.
Popular Ones:
- Moving Average (MA): It is used to smooth the price data to determine trends.
- Relative Strength Index (RSI): Assesses the momentum (overbought or oversold).
- MACD (Moving Average Convergence Divergence): Identifies changes in direction.
- Volume Indicator: It is in agreement with whether a price move is either strong or weak.
You do not need to learn all of them, just begin to observe the reaction of price to these instruments.
Example: Reading a Bitcoin Chart
Suppose you are looking at a 1-day chart of Bitcoin:
- The price continues to oscillate around the price of about 60,000 a couple of times- that is a price support.
- It cannot break above $65,000 that is resistance.
- RSI is in the 70s -Bitcoin may be overbought (price may fall).
With the combination of these signals, traders do not make uneducated guesses but make informed calls.
Safe and Smart Trading Tips
- Begin small: trade little at first till you are comfortable.
- Avoid emotional selling: do not run after the pump or panic-sell when the price declines.
- Set stop orders: auto-limit the amount that you can make.
- Dilute: Never keep all your eggs in one basket.
- Continue learning, markets change, and so does your knowledge.
Summary: Learn Before you Trade.
Cryptocurrency trading is fun, so it is not gambling. It is a matter of understanding the dynamics of the markets, reading the charts and risk management in a smart way.
You get deep into trading and charts:
- Educate, not to be emotional, but to be patient when it comes to faster profits.
- The smarter your decisions will be the more you know in this constantly changing digital market.